![]()
![]()
|
|
If you want to collect data from the server, you need to select "Active", so that MONyog will collect and store various MySQL and OS metrics.
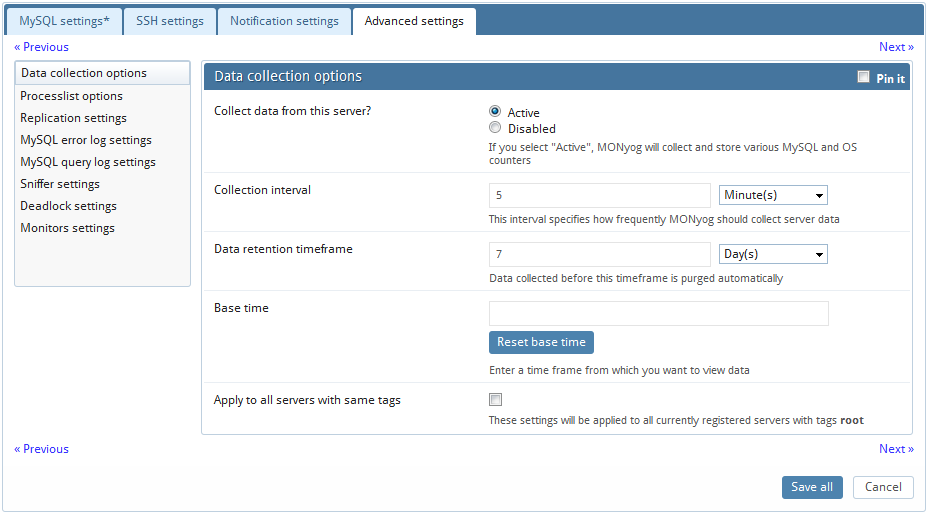
'Pin it' is used to display the all or particular option(s) or settings in a continuous flow. It is only a 'display' option for that page. If 'pin it' is checked, the details of a particular setting will not be hidden when the user switches to another option on the main options panel.
Define the collection interval for every server as you want.
You can also define the time interval between two successive retrievals of data. What is appropriate will depend - but for production systems a setting between 2 and 10 minutes is a good place to start.
MONyog is designed for storing large amounts of data for long periods of time. Data collected before the specified timeframe is purged automatically. Timeframe may be specified in seconds, minutes, hours and days for particular server.
For calculation of uptime-based counters the current value of each status variable will be compared with either of those,
server status variable 'uptime'
server status variable 'uptime_since_flush_status'
MONyog 'base time' setting
If MONyog 'base time' setting is defined and server status variable 'uptime_since_flush_status' is available then, 'uptime_since_flush_status' will be used, if it is not available then base time will be used. Note: Currently 'uptime_since_flush_status' is only available on 5.0 COMMUNITY servers from 5.0.37 - not on ENTERPRISE servers and not in any other major branch than 5.0 and also not in 5.0.x before 5.0.37.
The reason for this implementation is that if FLUSH STATUS is executed with a MySQL server, the server status variables will be reset to the same value as would be after a server restart. There is one important exception however and that is the 'uptime' status variable itself. This single status variable is not affected by FLUSH STATUS.
So, to get true uptime-based counters in MONyog with servers that do not support the 'uptime_since_flush_status' variable you will need to define a 'base time' in MONyog greater than or equal to the time where FLUSH STATUS was executed last time.
But also if 'uptime' and/or 'uptime_since_flush_status' is large ('old') you may use 'base time' setting to analyze uptime-based counters on an interval defined by you. For instance, if the server has been running for months you may choose to analyze uptime-base counters based on data collected from a specific time only as you have defined it.
Also, note that if the 'base time' is smaller than 'uptime' (or 'uptime_since_flush_status' if available), then 'base time' setting will be ignored. Using a 'base time' larger than 'uptime' and/or 'uptime_since_flush_status', then base time would be considered. If a base time is in future, then most recent collection time would be considered (similar to Delta).
You can specify the refresh interval in seconds, minutes, hours and days after which the processlist for the server can be seen in the "Processlist" interface. For further info refer to Processlist settings.
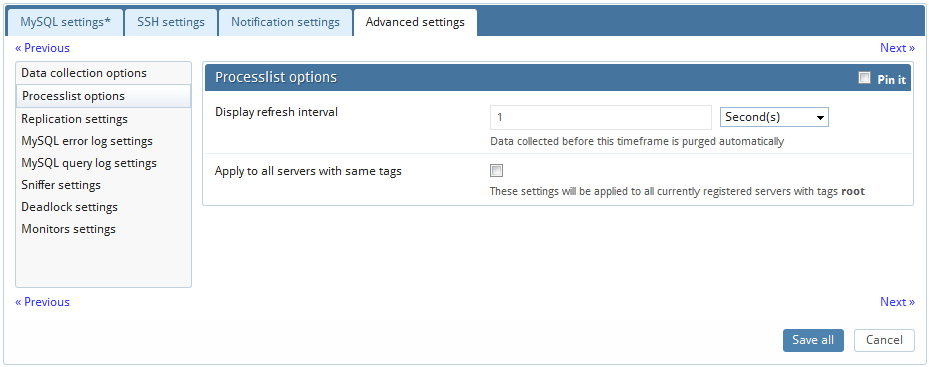
MONyog executes "SHOW FULL PROCESSLIST" on every server registered. How frequently this query is sent to the servers is independently configurable for every server. This setting is independent of the interval setting of other queries. You will probably want to send SHOW FULL PROCESSLIST (much) more frequently than "SHOW GLOBAL STATUS" and "SHOW GLOBAL VARIABLES". Consider a setting of PROCESSLIST interval in seconds similar to STATUS/VARIABLES interval in minutes (1 second and 2 minutes respectively for instance)!
MONyog monitors MySQL replicas by issuing a" SHOW SLAVE STATUS" on the slaves. MONyog can also auto-register slaves, given the master details.
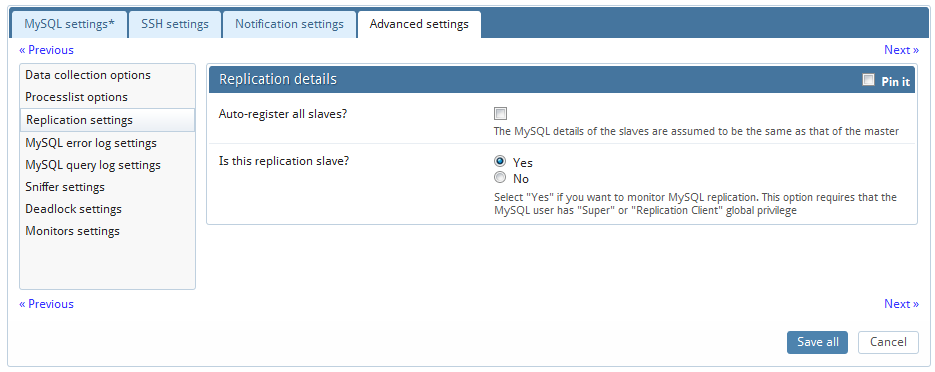
Select "Yes" if you want to monitor MySQL replication. This option requires that the MySQL user has "Super" or "Replication Client" global privilege.
Automatic registering of slaves
This feature of MONyog saves you time from registering each slave individually. In order to ask MONyog to auto-register all slaves, you would need to 'check' the option to "Auto-Register slaves" in the 'Advanced settings' tab while registering a slave. If in case a master is already registered, click 'Edit Server' and check the 'Auto-Register slaves' in the 'Advanced settings' tab .The MySQL and the SSH details of the slaves are assumed to be the same as that of the 'master'. In case the slave details are different from that of the master, you will have to manually go edit that server and change details.
The auto-registering of slaves is extended to multiple levels of replication. For instance, lets say Server A is a Master that has Server B as the slave. And Server B has Server C as its slave. In such a case, while registering Server A if you check 'Auto-Register Slaves', then it would register A, B and C provided the MySQL and the SSH details of the A is same as that of B.
How does MONyog auto-register all slaves of a given master? MONyog will shoot a "SHOW FULL PROCESSLIST" on the master, and check for all the slaves connected. (It will assume the MySQL and the SSH details of the slaves are same as that of the master.) To view replication topology click on the 'Replication tab'.
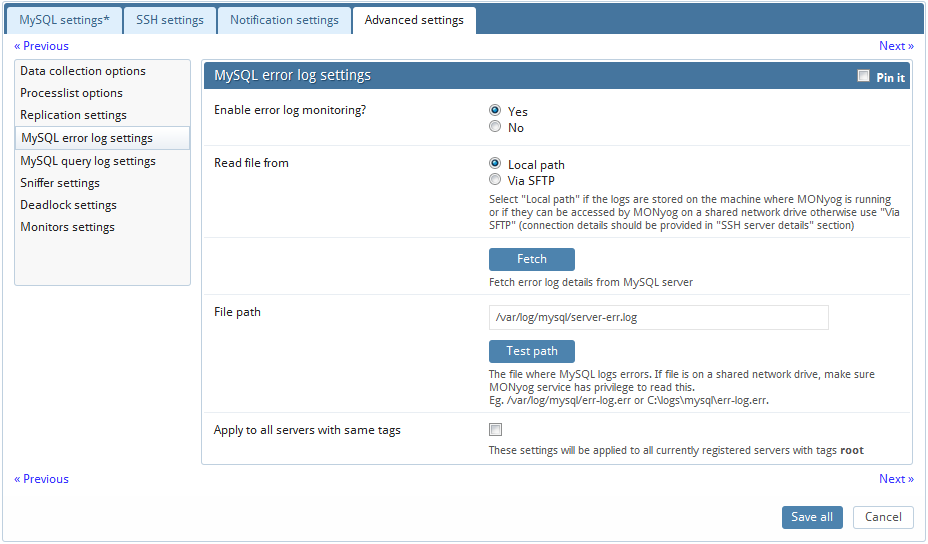
The MySQL error log is quintessential in determining the health of the server. You can enable error log monitoring to allow MONyog to keep an eye on your MySQL Error Log, and notify you of important information that may save you many sleepless night.
Enable error log monitoring: Select "Yes" if you want to enable error log monitoring.
Read file from: Select "Local path" if the logs are in the machine where MONyog is running, or if they can be accessed by MONyog on a shared network drive. Choose "Via SFTP" if you have configured MONyog to use SSH.
Fetch error log details: MONyog can automatically get the path of the error log from the MySQL server. Just click on this button, and MONyog will do the rest for you.
File path: If you choose to enter the error log file path manually, you may do so here.
Test path: Click on this button to have MONyog check if it can access the file specified by the path.
MONyog retrieves (completely or partially) the General query log and the Slow query log from the MySQL servers it connects to, and analyzes them. Here, we will see how to set up details for the connection, so that log analysis will be available with MONyog. You will have to set up details for the general query log and the slow query log independently. Enabling slow query log 'log queries not using indexes' instead needs SUPER privilege. Refer to the MySQL documentation on how to enable and configure logging. MySQL server logs can be written to files on the server machine or to tables in the MySQL database itself.
The MySQL server (since version 5.0) has an option to log (in the slow log) queries that do not use an index. Such queries need not be slow if there are only a few hundred or few thousand records in the table(s) involved. But they are 'potentially slow' and should be identified if they access tables, which will continue to grow. You can enable and disable this from here too (MONyog will send the appropriate SET of statements to MySQL). Note: Only DML and DDL queries are recorded in the slow query log.
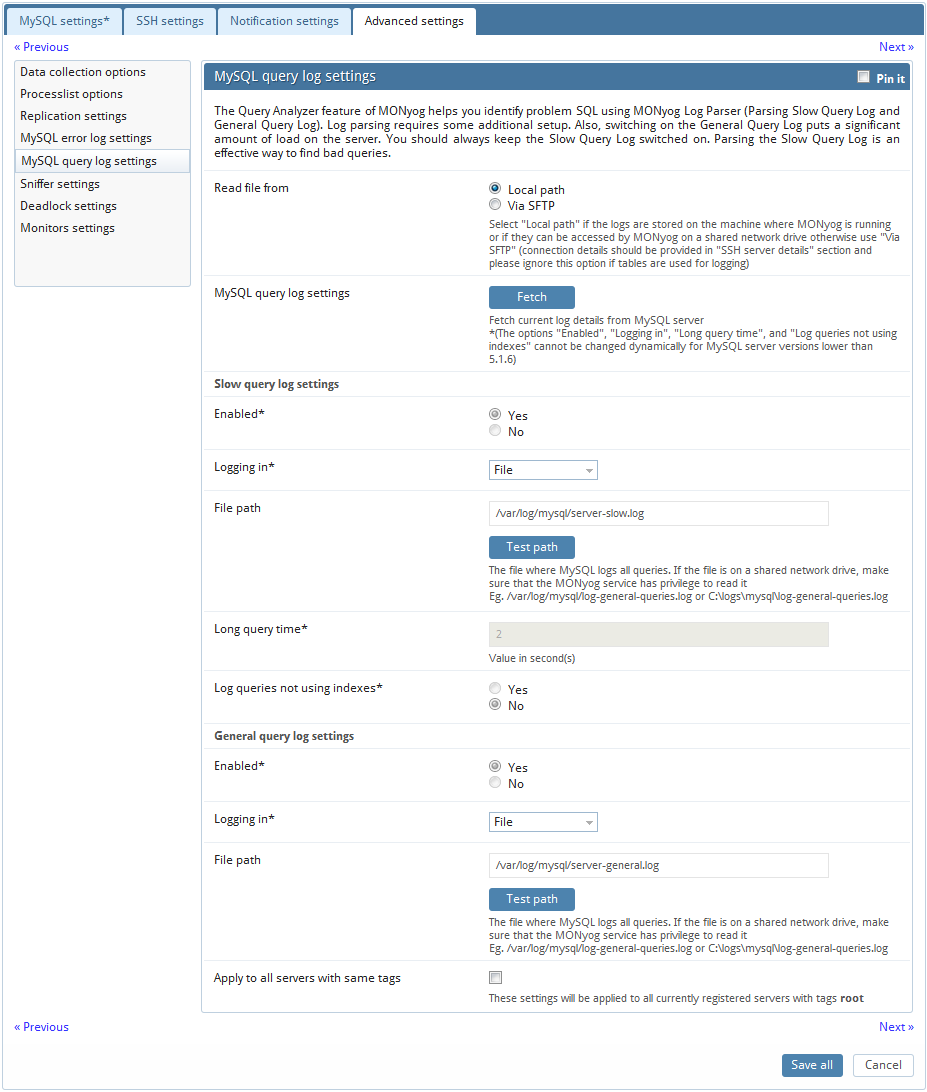
Logs written to files:
First, we will consider the situation where server logs are stored as files on the server machine. This is the most common situation and the only one available with MySQL servers before version 5.1. First time you configure a server with this option you should click the 'Fetch log details from MySQL' button. The MySQL server 'knows' (it is stored in server variables) what logs are enabled and how logging is configured. You do that independently for the slow log and the general log. It will return everything you need except the path to the log file. This you will have to enter yourself. Click 'Test Path' to verify that the path was entered correctly. MONyog will connect and verify the existence of the file (but not its content).
The log files can be accessed from the local file system (if MONyog and MySQL is running on the same computer) or by using SFTP (if MONyog and MySQL is running on different computers). You should note that you must use the file and path syntax of the machine where the logs are.
If the log files can be accessed from a shared drive, over a network, or from a network enabled file system (like NFS on Linux), then MONyog can access them as if they were local files. No additional SSH/SFTP configuration is required in this case: the operating system will take care of the file transfer transparently.
When 'via SFTP' option is chosen, then SSH server details as defined in 'SSH server details settings' are used to read the file from the remote system. Note that the SSH user must have read access to the log files!
If MySQL server version is greater than 5.1.6 then all the fields mentioned in log analyzer would be editable i.e. if a user changes and saves the settings by clicking on 'Save Current Log Details To MySQL' button, it would be reflected in the corresponding server.
Note that by default MONyog service runs under Local System Account. If you have Slow query or General query logs in a Mapped Network Drive, MONyog will not be able to reach it. You need to use UNC notation for MONyog to be able to access them. See FAQ 32 for details.
Logs written to MySQL tables:
This option is supported by MySQL from version 5.1. Also, MONyog supports when this option is available. Here, you click the 'Fetch Log Details From MySQL' button. When this option is used there is no file path to configure and no SSH details to consider. MONyog can retrieve the server log by sending simple SELECT statements. Only the MySQL user used by MONyog to connect to MySQL must have SELECT privileges to the tables.
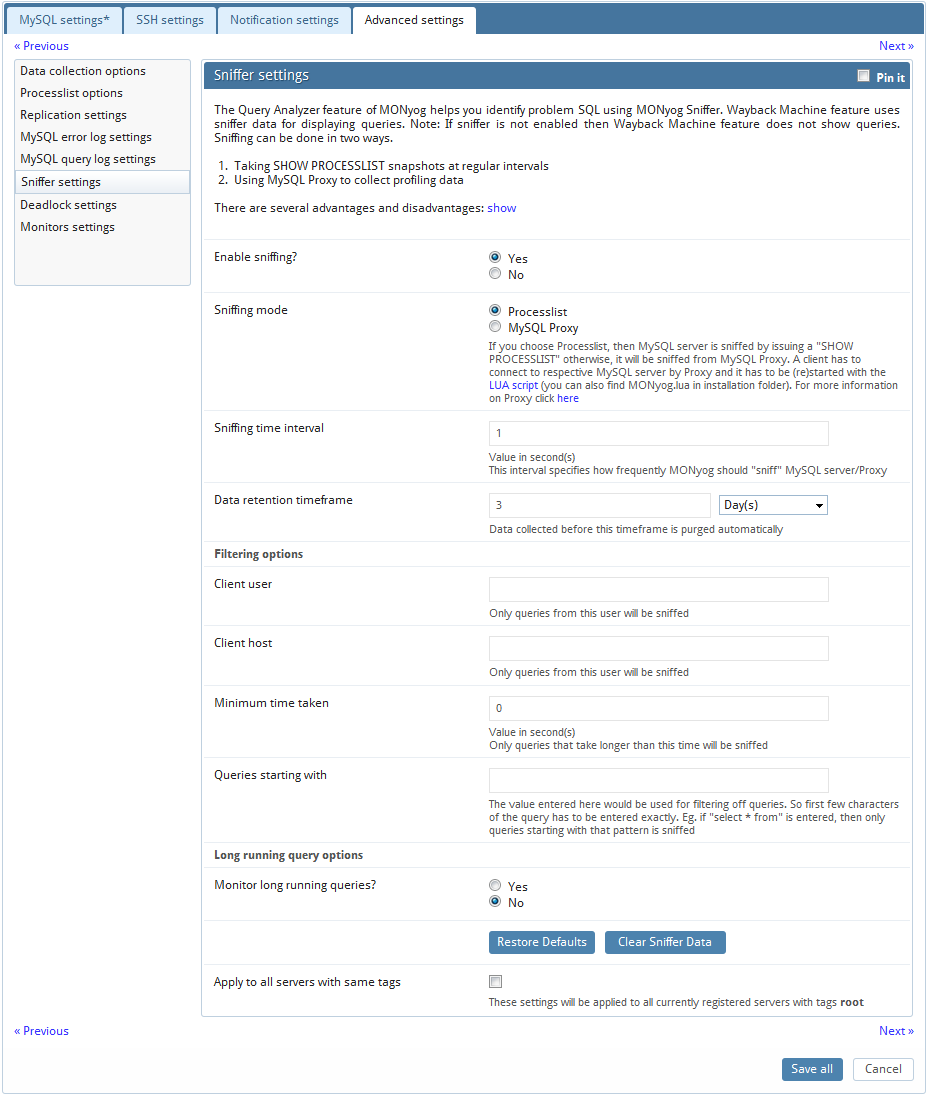
MONyog's 'query sniffer' is a functionality that records a 'pseudo server log' and stores it in the MONyog embedded database. With 'query sniffer' enabled, MONyog can populate the 'pseudo server log' in two different ways at the intervals you specify:
by sending the query SHOW FULL PROCESSLIST to the MySQL server.
or by connecting to a running instance of the MySQL-Proxy program that is used by one or more clients to connect to a MySQL server.
Note that, although configuring a Proxy instance is a little more complicated, the PROXY-based sniffer has several advantages over the PROCESSLIST-based one, including:
All queries that was handled by the Proxy will be recorded by MONyog 'sniffer' when PROXY option is used. When PROCESSLIST option is used very fast queries may execute completely between two SHOW FULL PROCESSLIST queries and will then not be recorded.
You can choose to analyze queries from specific client(s)/application(s) only. Simply let (only) the clients that you want to focus on at the moment connect through the Proxy.
When using the PROXY option you can distribute part of the load generated by the sniffer on the machine that fits best in your deployment scenario (like on the one that has most free resources available) by deciding where to have the PROXY: The MySQL machine, the MONyog machine (if not the same) or quite another machine. The machine running MySQL will have no additional load due to the sniffer if the Proxy is not running on that machine.
Also note that, if more MONyog instances use the same PROXY they will use the same data collected, when the Proxy Sniffing is enabled by the first MONyog instance. To work with MONyog sniffer the MySQL Proxy instance must be started with the name of a LUA script called 'MONyog.LUA' (LUA is a scripting/programming language) as argument and is distributed with MONyog. Also refer how to start with the LUA script. You will find it in the MONyog program folder after installing (Windows and Linux RPM) or unpacking (Linux .tar.gz) the MONyog program package as downloaded from Webyog website. The MySQL Proxy program however you will need to download from MySQL website (we cannot include it for license reasons). MONyog works with Proxy versions from 0.61 to 0.81(latest currently) with the exception of 0.7x versions for windows and Mac due to a bug in those specific builds. For more information on Proxy click here.
To start a Proxy instance for use with MONyog use the command:
For Older version:
Proxy installation folder>mysql-proxy --proxy-backend-addresses=192.168.x.x:3305 --proxy-address=192.168.y.y:4045 --proxy-lua-script=MONyog.lua
For v0.81(Alpha):
Proxy installation folder>mysql-proxy --proxy-backend-addresses=192.168.x.x:3305 --proxy-address=192.168.y.y:4045 --admin-username=root --admin-password=root --admin-lua-script=MONyog.lua --proxy-lua-script=MONyog.lua
(It is assumed that the 'MONyog.LUA' was copied to the folder where the PROXY binary is). Also note that, if no port is specified the PROXY will listen on port 4040. Now you can connect to the Proxy from one or more clients/applications. The Proxy will send queries to MySQL and results back to the client. But when started with the LUA script for MONyog sniffer it will also send information to MONyog that MONyog will use to populate the sniffer 'pseudo log'.
Once this 'pseudo log' has been recorded (in either of the two ways described: PROCESSLIST or PROXY-based) the MONyog log analysis functionalities can operate on the 'pseudo log' as well as the 'real logs'. The data recorded in the 'pseudo log' will be purged automatically based on the 'data retention timeframe' option set by you.
Further some filtering options are provided. Note that this filtering happens before storing to the MONyog database. This will prevent the sniffer database to grow out of control! The filtering options are:
User and host: You can choose to store queries executed only by a specific combination of users and/or hosts.
Minimum time taken: For every PROCESSLIST returned to MONyog, the queries will be recorded in the embedded database only if they have been executing for a time greater than the specified minimum execution time. Furthermore, if a query with the same structure and details (like process ID) as one already recorded is encountered, the embedded database will be UPDATED, and the statement will be recorded only once.
Note that, this setting should be somewhat larger than the sample interval (and also consider the latency of the connection). If set lower it won't really make much sense!
Queries starting with: Enter any string and only queries starting with that string will be recorded. Examples: "SELECT *", "UPDATE Customer_Base".
Also note that in PROCESSLIST Sniffer we have an option 'Long Running Query Options' where you can monitor the long running queries by notifying or killing a query which takes more than a time specified by you. You can also specify users whose queries will be ignored (i.e. queries by such user will never be killed by MONyog and never raise an alert even if they take a longer time to execute than the alert/kill setting time you specified.
Clicking on the 'monitor only locked queries' would only monitor those long queries that are locked.
You should note of course that the query sniffer will never be a complete 'general log'. Very fast statements may or may not be recorded as they may or may not finish executing between two PROCESSLISTs generated. The time interval between subsequent data collections for the 'pseudo log' depends on the connection to the MySQL server.
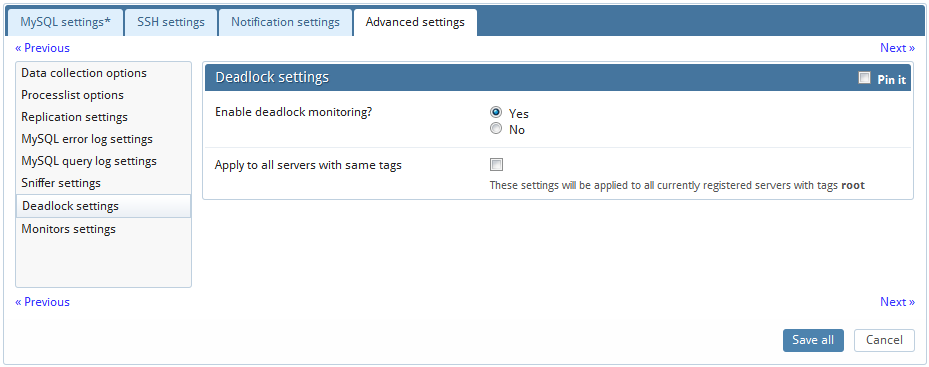
In transactional databases deadlocks are a classic problem, but these deadlocks are not too dangerous unless they are so frequent that you cannot run certain transactions at all. To trace the deadlocks reported by INNODB STATUS, you can enable "Deadlock Monitoring" option.
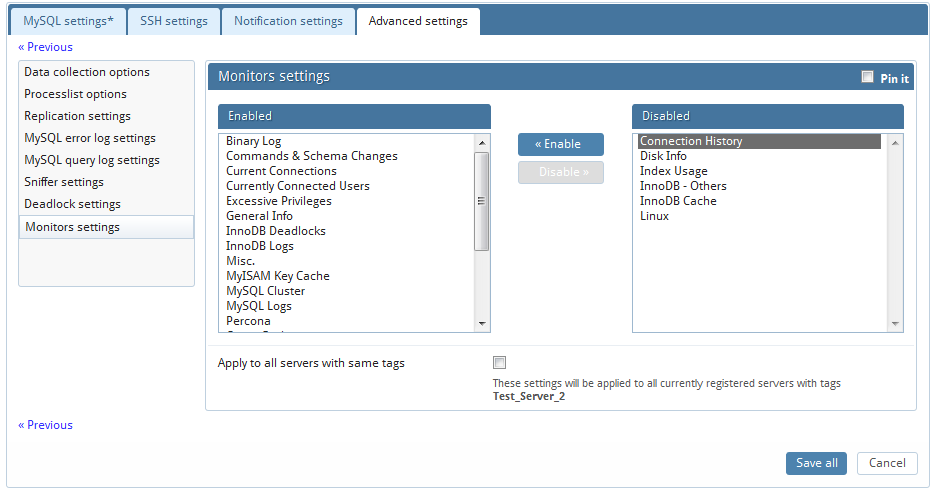
MONyog provides a way of disabling an entire group of Monitors. For instance if a MySQL server is not a replication slave, then the replication group can be disabled.
|
|