![]()
![]()
|
|
Adding new Monitors and Dashboard Charts
To add a new Monitor do the following:
Click on 'Add new Monitor' link on MONyog 'Monitors' page.
Choose the type of counter - MySQL, System or Custom SQL.
Type in the name of the group to which this monitor is being added.
Enter the name of the counter being added.
Formula - A MySQL server parameter that would be needed to compute the value of this counter.
Value - This defines a function that computes the value.
DocText - Discription of Monitor.
Advise Text - Advise text to the Monitor being added.
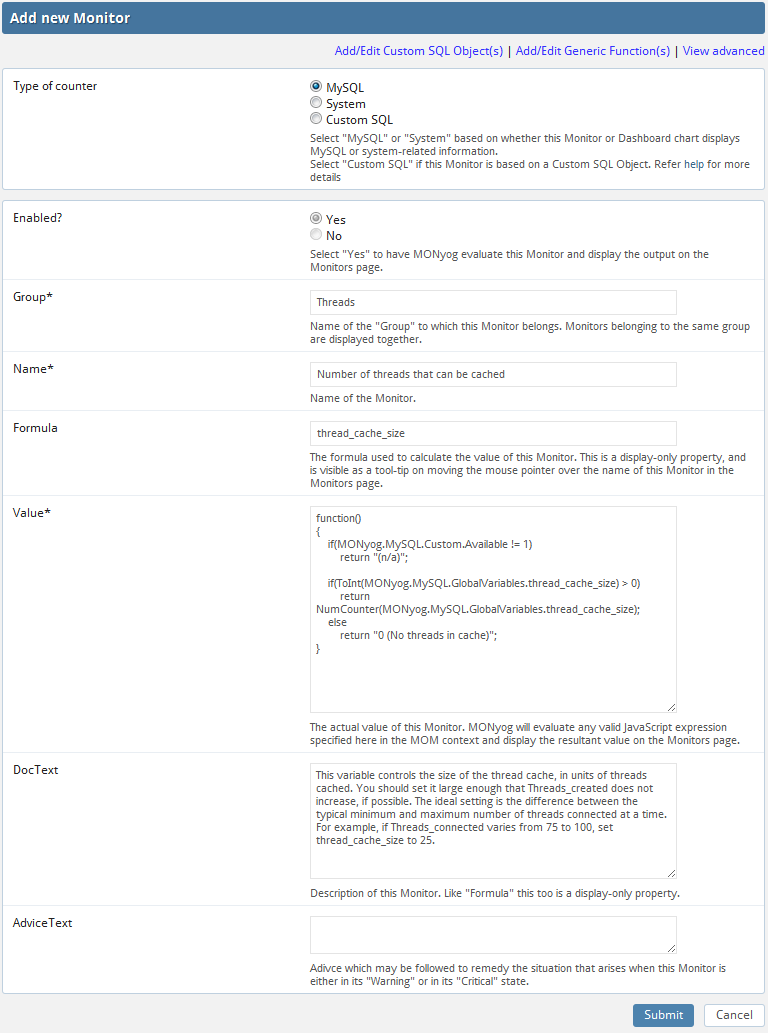
In this customization form each field corresponds to a valid MOM property. Some fields take on valid JavaScript expressions while others take on text/HTML as values. The values entered in these fields are used to generate JS objects which are basically name-value pairs.
'View simple' displays properties which are basically necessary to define a Monitor. Properties with asterisk(*) are mandatory. To customize the behavior of the Monitor further, clicking on 'View Advanced' will display all MOM properties.
Note: To know more about adding Custom SQL Counters(CSCs)
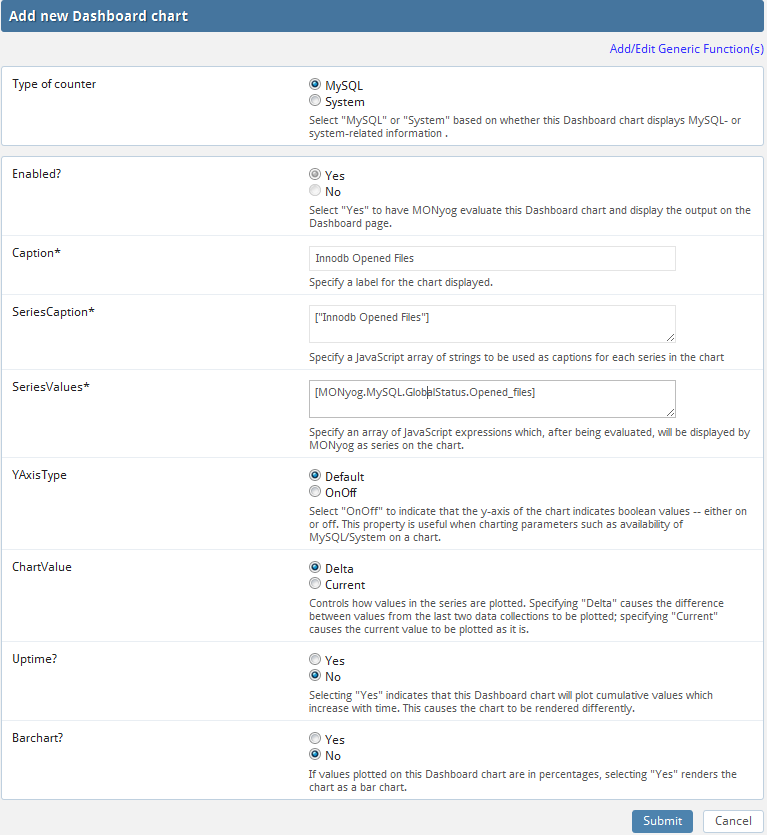
Click on 'Add a new chart' on the dashboard page.
Select the desired type of counter - MySQL or System.
Caption - Enter an appropriate name for your chart.
SeriesCaption - Specify the names of all the graphs that are going to be plotted. Example: ["Attempts", "Refused", "Terminated abruptly"] Here 'Attempts', 'Refused' and 'Terminated abruptly' are the names of the graphs that are going to be plotted on this new chart being created.
SeriesValues - Specify a JavaScript array of strings to be used as captions for each series in the chart. Please refer to MONyog object model for more details.
ChartType - Currently 'RealTimeLine' is the only supported chart type.
YAxisType - Specifying "OnOff" would mean that that YAxis of the chart indicates boolean values. Example: Have a look at the default chart 'MySQL Availability' shipped with MONyog.
ChartValue - Controls how values in the series are plotted. Specifying "Delta" causes the difference between values from the last two data collections to be plotted. Specifying "Current" causes the current value to be plotted as it is.
Uptime - Selecting "Yes" indicates that this Dashboard chart will plot cumulative values which increase with time.
Refer Manage changes for more information on managing Dashboard charts and Monitors.
Common functions required across multiple Monitors can be put into generic functions. For example, the function 'StorageUnits' defined in generic functions takes a numeric value as a parameter and returns a string which is the value specified in terms of K(ilo), M(ega), B(ytes), etc. To add or edit generic functions click on the 'Add/Edit generic functions' link while adding/editing a Monitor or a Dashboard chart.
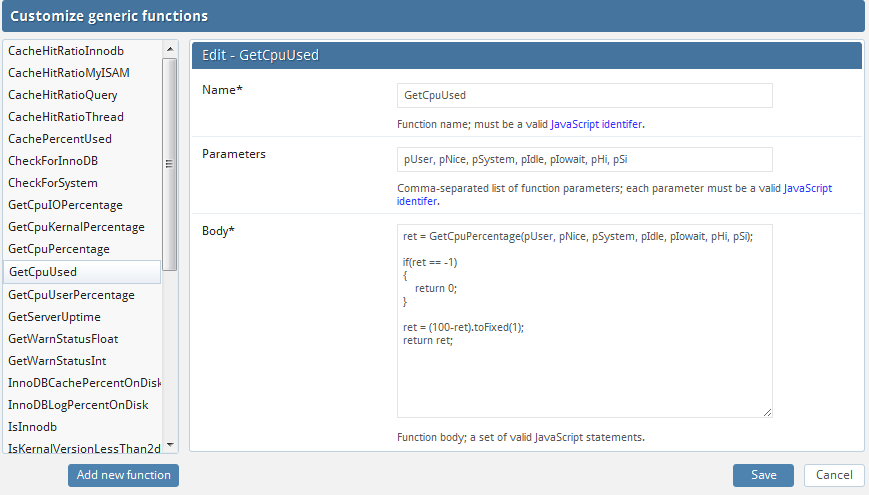
To get detailed description of values refer MONyog object model for more information.
|
|