![]()
![]()
|
|
The 'InnoDB deadlock' monitor is a little different than the rest of the monitors and will require a little additional explanation. Whereas all other monitors are based on the return of SHOW GLOBAL STATUS, SHOW GLOBAL VARIABLES and SHOW SLAVE STATUS, the 'InnoDB deadlock' monitor is based on output from SHOW ENGINE INNODB STATUS. This statement differs from the first-mentioned in the sense that it does not return as single discrete value (like a single number), but a rather long string instead with lots of information. From this long string we extract what is related to deadlocks.
With this monitor it does not make sense to distinguish between 'Current' and 'Delta' timeframes. They will display the same in MONyog - like this,
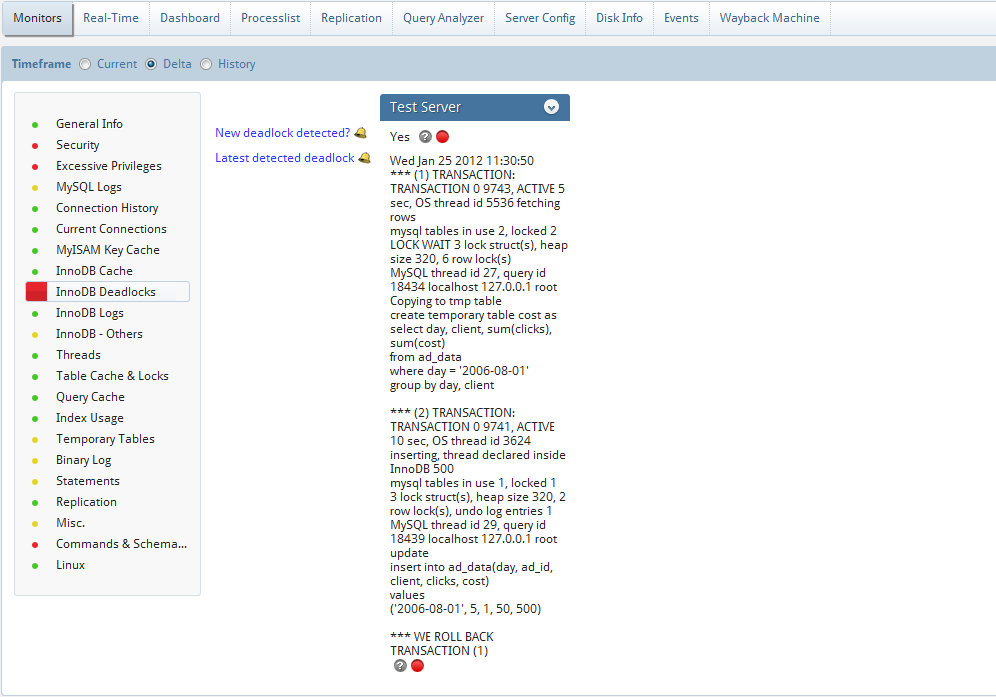
'new deadlock detected' tells if a new deadlock was reported by INNODB STATUS between the last two data retrievals. 'last deadlock detected' shows information about the last deadlock detected (if any). To view all deadlock situation that MONyog has information about use the 'History' timeframe.
Note that there is a limitation with deadlock information returned by SHOW ENGINE INNODB STATUS that will also affect MONyog: It returns only information about the last deadlock. So if more than one deadlock has occurred between two data retrievals, MONyog will only have information about the latest.
NOTE: Security, Excessive Privileges, InnoDB Deadlocks and Replication counters are available only in MONyog Ultimate.
|
|