![]()
![]()
|
|
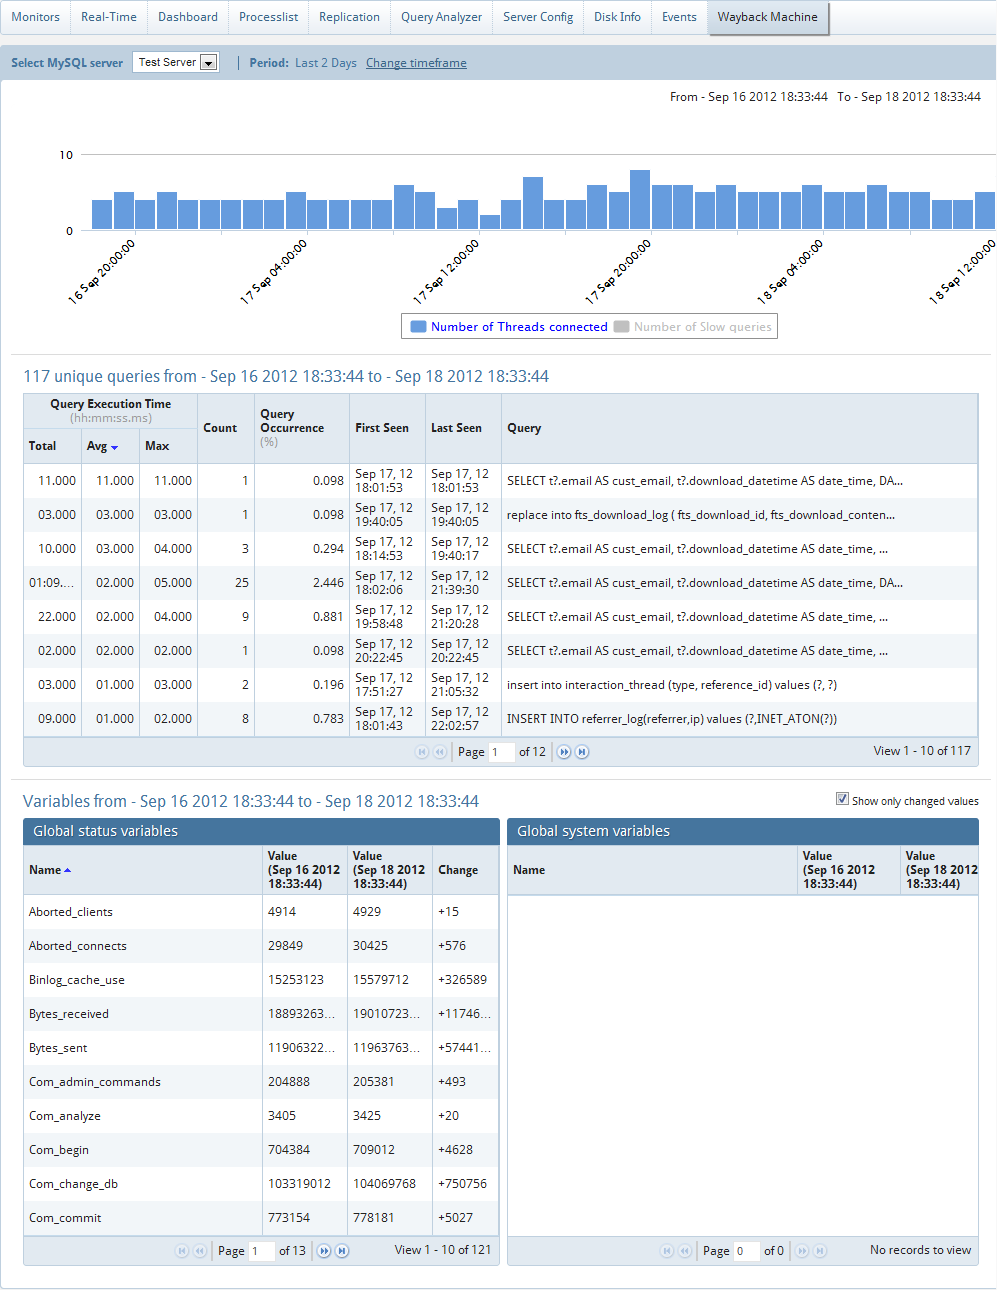
Wayback Machine displays information about these variables:
1) Threads connected
2) # of slow queries.
The graph displays aggregating values on years/months/days/hours/ minutes depending on the data. If sniffer was running during this interval, aggregated sniffer information will be displayed for the time interval. Also you can see first and last value of (optionally) all or changed variables aggregated values. The graph is zoomable by selecting a sub-interval with the mouse. Along with aggregated sniffer and changed variables you can also get point-in-time information by clicking on a point in the graph.
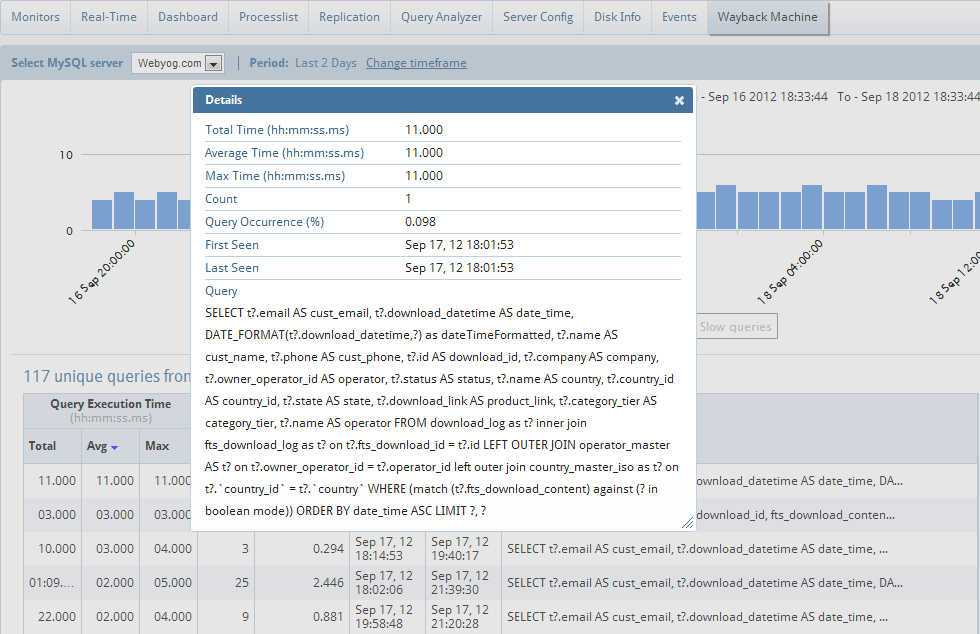
When user clicks on a row in the query list of the Wayback machine a pop-up opens with information about thread-id, user and host along with full query.
The list of queries in Wayback Machine will not be rendered if there are more than 2000 queries in the time period. There is a user control that can be activated in such case. The reason is that every 1000 queries take around 1 seconds to render on an average desktop system. This also means that we can now display the list of queries before zooming (provided still that there not more than 2000 queries to display).
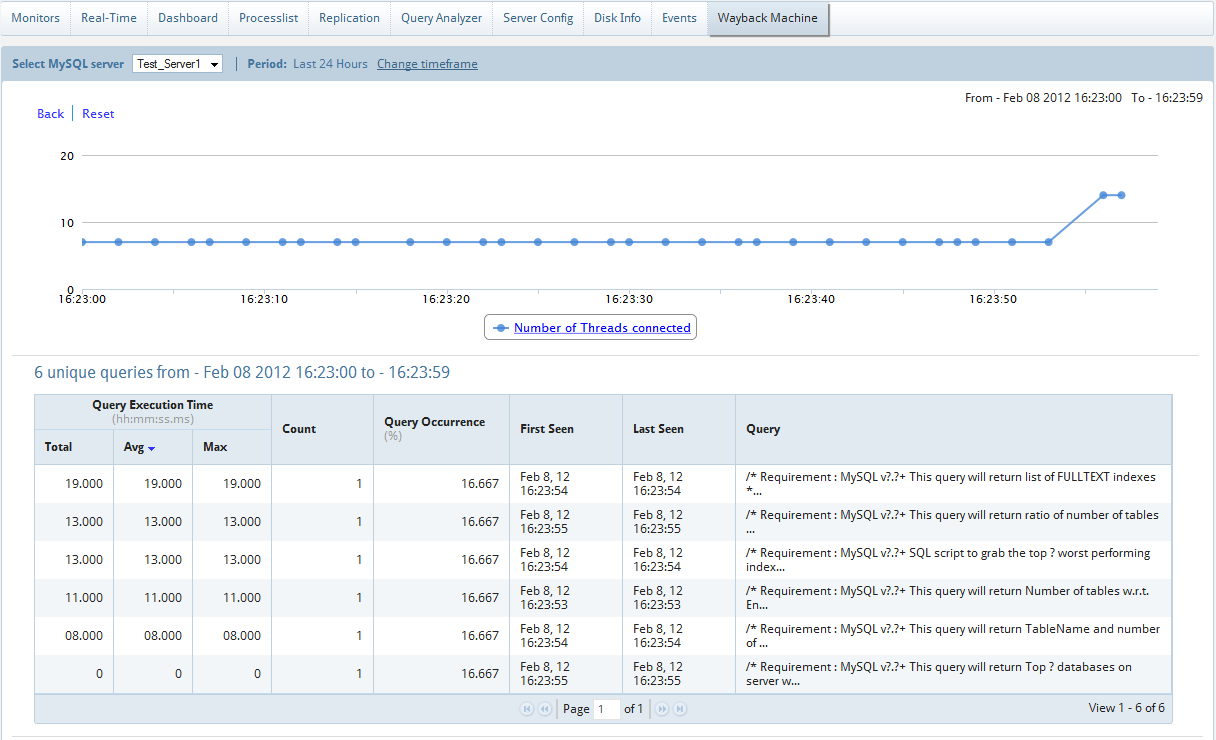
When we do a point in time select of one of the points on the graph, we get a bar chart that displays number of queries from the previous point to the point that is selected. Clicking on the bars will display queries running at that point in time.
NOTE: This feature is available in MONyog Enterprise and Ultimate.
|
|