![]()
![]()
|
|
How History/Trend analysis helps a DBA?
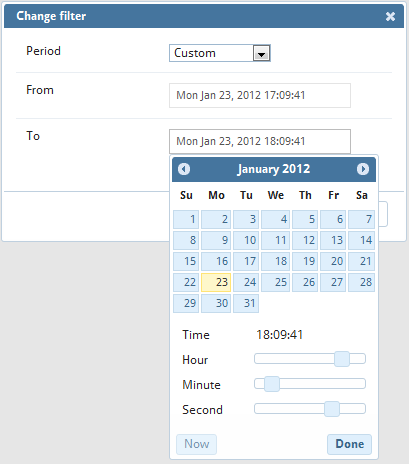
The 'History' option in the 'Monitors' interface will let you select any time interval for the metrics display. This setting is a client side (browser specific) setting. The default setting is the last 1 hour before connection to MONyog was established, but to change just click the 'Change timeframe' link in the 'Monitors' interface toolbar. A new window will display where you can select common options like 'last 1 hour', 'today'. 'this week' etc. If you want to specify the exact start and end time, select custom option and click the calendar icon. This window is editable and you can define any values.
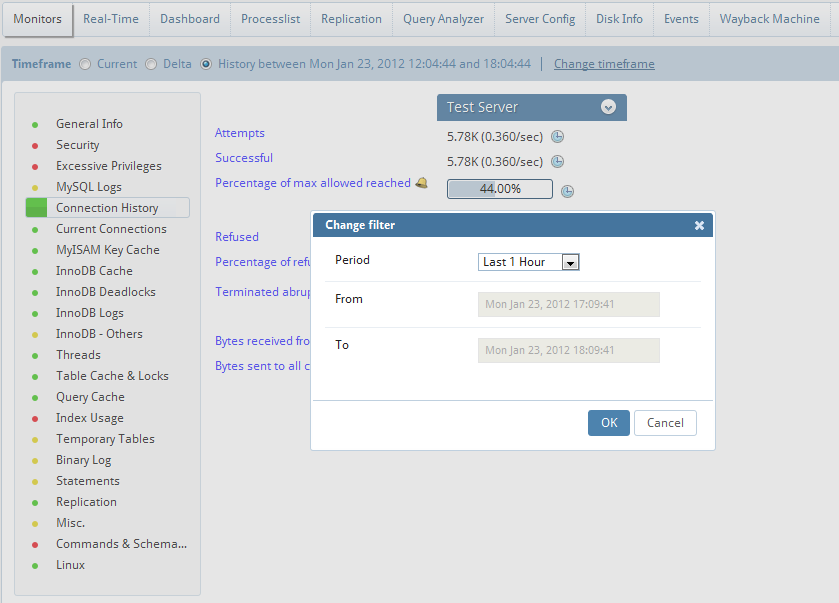
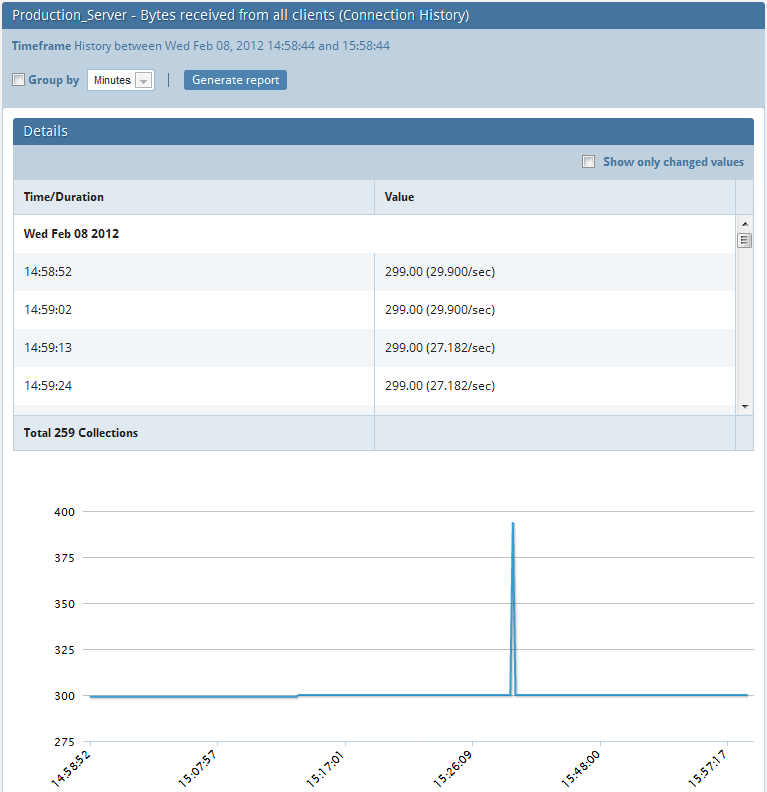
Click the 'clock' icon displaying in the 'History/Trend' view for the server and monitor that you want to display.
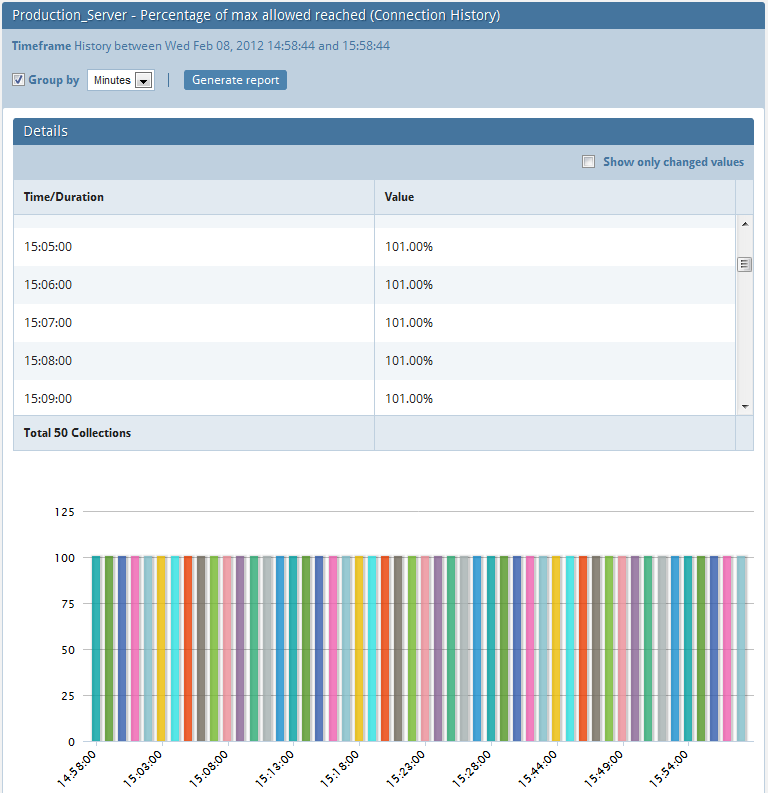
For UPTIME-based counters (or, if you like, CUMULATIVE values retrieved from the servers, as opposed to SNAPSHOT
values) there is also an option to group results into certain categories. This option will display the aggregated SUM for the time-setting selected (the query to the MONyog database will be like "SELECT SUM (<MONyog_object>)... GROUP BY <time-setting>"). The time-settings available range from <Minutes> to <Years>. Once you have defined the options you want to use, click 'Generate report' and the page will populate with data in a table/spreadsheet-like as well as a graphical view.
See below the effect of not using, respectively using the GROUP BY option.
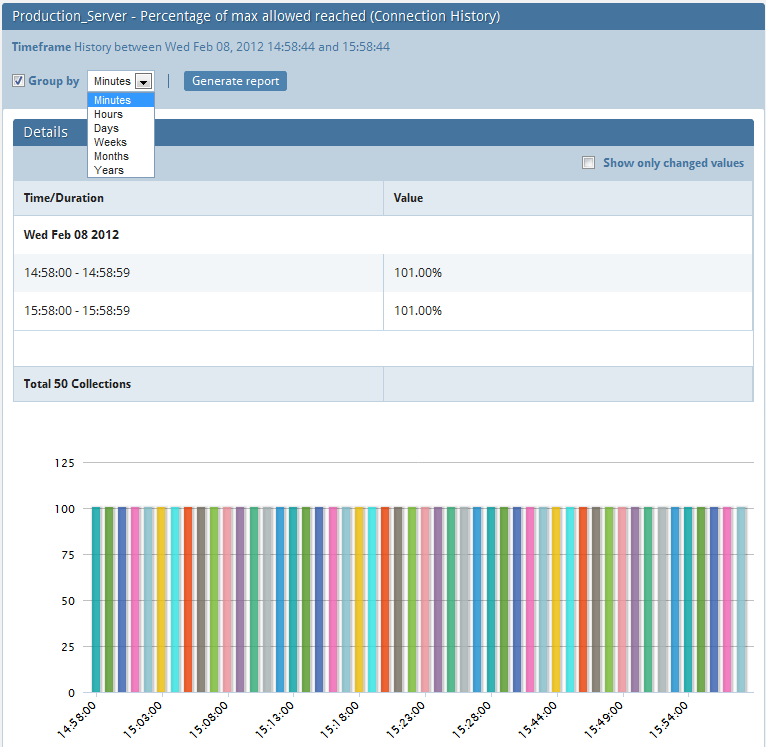
Which type of data can be grouped?
When the mouse pointer hovers over any plotted value in the graph displayed, a tool-tip pops up, showing more details for that particular value.
The 'History/Trend' option uses per definition a statical time setting once the time interval has been defined. As a consequence no automatic updation takes place (no need... it would be the same!). To change the display, return to the first MONyog page and click the 'Change timeframe' link in the 'Monitors' interface toolbar again.
You can have as many 'History/Trend' pages displaying at a time as you want (with possible browser limitations!).
Note that if you want to use this feature extensively you would probably want another 'retention interval' setting for the connections than the default setting (7 Days).
Also note that if you are retrieving data for a long time interval from the MONyog database (and possibly even calculating GROUP BY aggregates) the actual MONyog/SQLite database file will be locked for as long as the calculation lasts. If another user is connected and displaying the Dashboard or the 'Monitor or current' interface for instance, it will not update before the LOCK is released. Actually in that period no data will be INSERTED either. But don't worry - INSERTS will be queued and the database updated when possible.
NOTE: This feature is available in MONyog Professional, Enterprise and Ultimate.
|
|