![]()
![]()
|
|
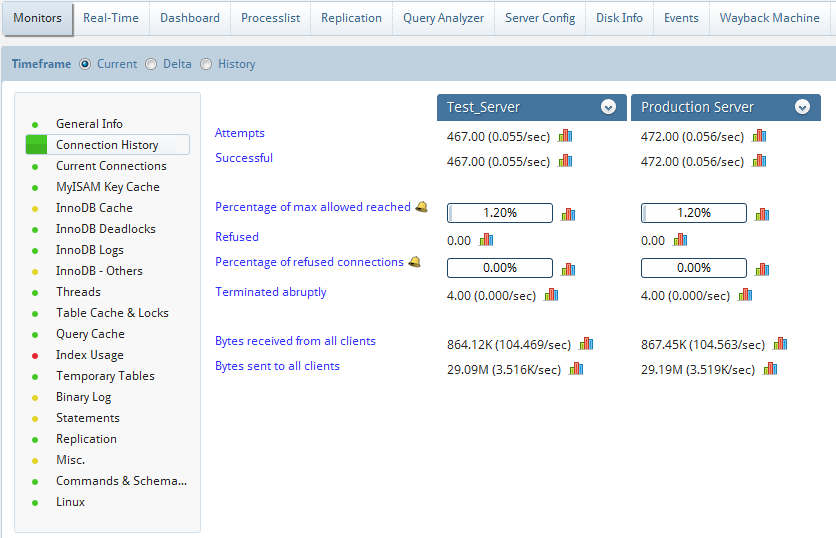
The bell icon indicates that the corresponding counter will be included in the e-mail alerts sent to you, provided that:
You have chosen to send mail alerts for the specific server.
The value for either the 'current' or the latest time frame exceeds warning level.
A graph or chart is a type of information graphic or graphic organizer that represents tabular numeric data and/or functions. Graphs are often used to make it easier to understand large quantities of data and the relationship between different parts of the data. Graphs can usually be read more quickly than the raw data that they come from.
Clicking on the graph icon will display a graph, depicting the current status of some metric of the server, which is updated in real-time.
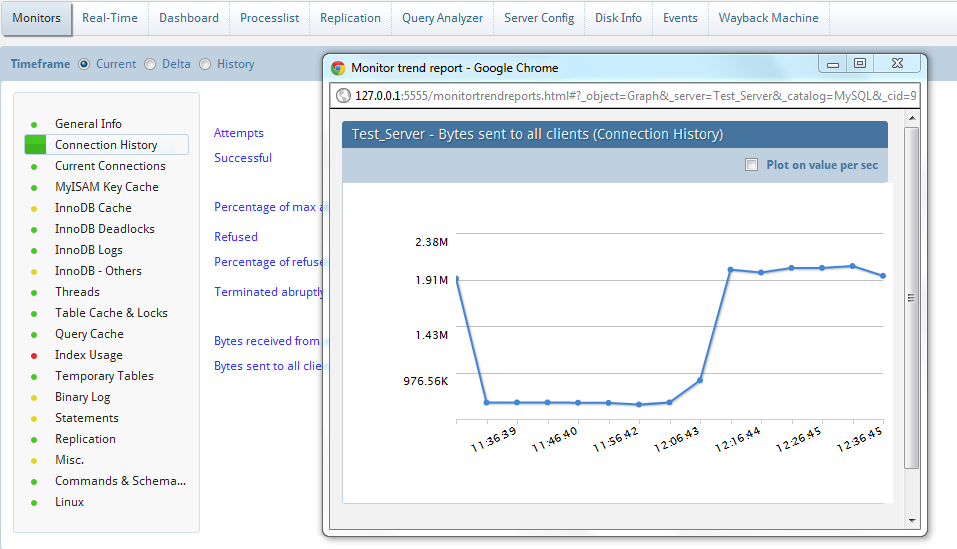
Also, Charts and graphs displayed by the Monitors can now be exported in PDF/JPG/PNG formats. Refer "Exporting graphics".
NOTE: Security, Excessive Privileges, InnoDB Deadlocks and Replication counters are available only in MONyog Ultimate.
|
|