![]()
![]()
|
|
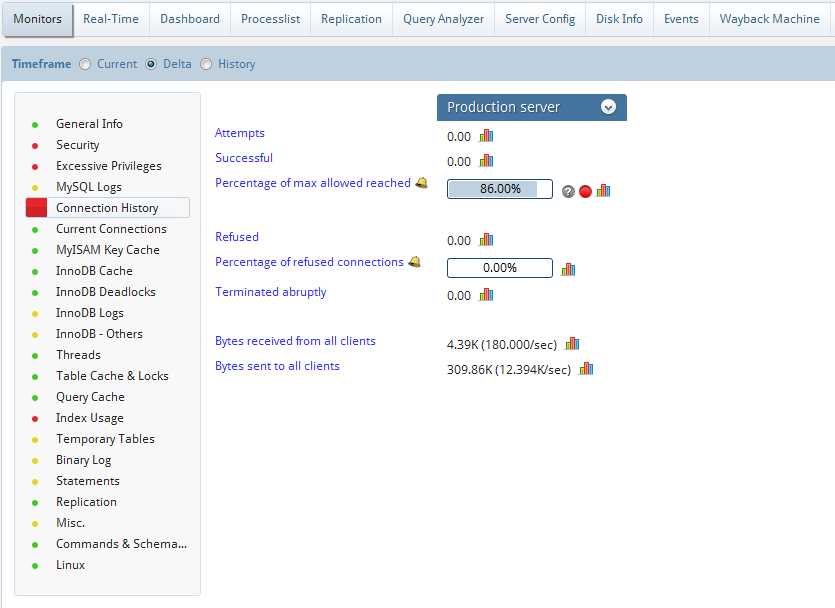
Red and Yellow alerts will quickly tell what could be issues to investigate.
In case a red or yellow dot appears beside a metric, it means that the current value of the metric exceeds the set threshold value, ie., the dots signify alert conditions. The definition of what should trigger a red or yellow alert is defined in the JavaScript component defining every metric. The default values that MONyog ships with have been configured for average servers used for mixed purposes: a mix of websites and databases with corporate data, for example. You may want to change the values depending on the type of databases. Threshold values for the metrics (and also actual, realizable, values) will vary depending, at the very least, on the type of applications that use the database. For instance with certain web applications like Forums a very high 'cache hit rate' typically can be reached (as a large %age of queries will return the most popular post in the Forums) whereas in a production planning system it is typically not possible to achieve a very high hit rate (as identical queries and results only rarely occur here).
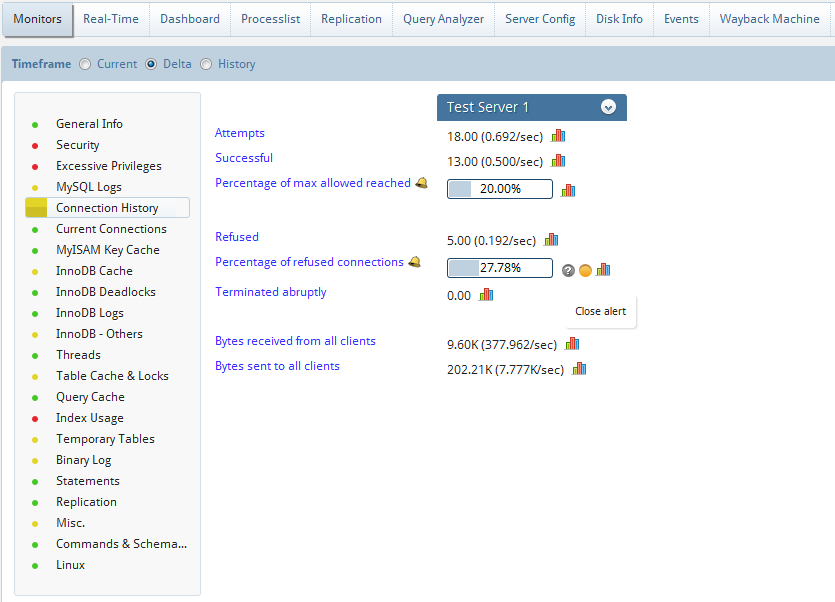
Practical advisors immediately available for every alert.
You may position the mouse over the 'red dot' a critical alert and an advisor on how the server could be configured to boost performance in respect to this particular will show in another tool tip.
Also you may position the mouse over the 'yellow dot' a warning alert and an advisor on how the server could be configured to boost performance in respect to this particular will show in another tool tip.
NOTE: Security, Excessive Privileges, InnoDB Deadlocks and Replication counters are available only in MONyog Ultimate.
|
|