![]()
![]()
|
|
MONyog is shipped with a bunch of charts like 'Database Transactions', 'Replication Slave', 'Row Access Statistics' etc that could be very helpful in monitoring your MySQL servers. You can find these charts by clicking on 'Manage Dashboard charts' from the 'Dashboard' page OR from 'Customize' -> 'Manage Dashboard Charts'. In addition to enabling and disabling these graphs you can also re-order them.
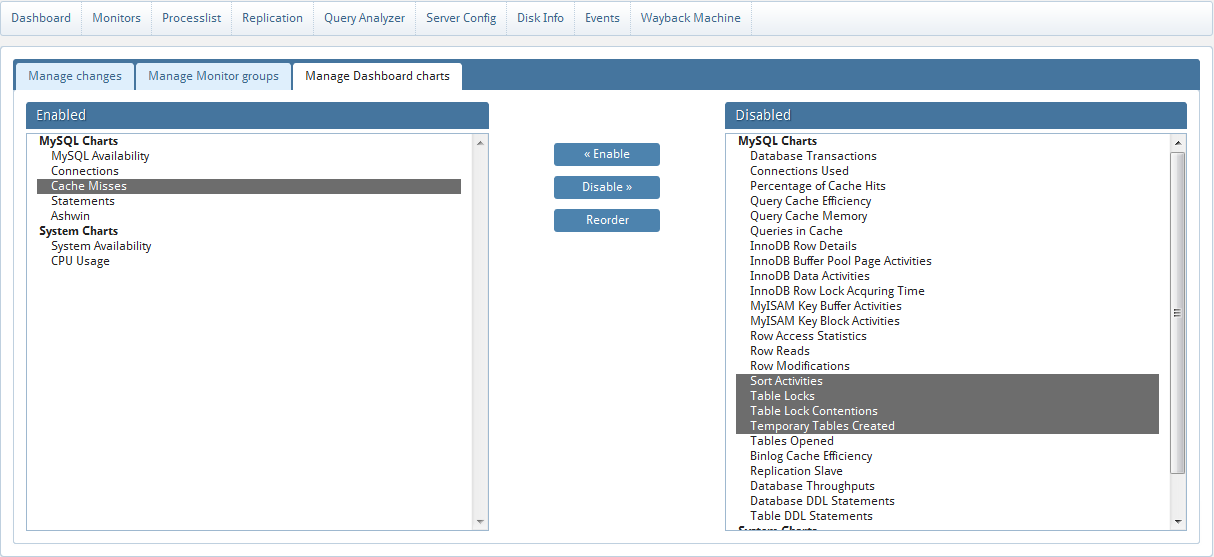
NOTE: Pre-canned charts can be enabled/disabled only by an admin user.
|
|