![]()
![]()
|
|
In order to start using Real-Time, you will have to select a server from the dropdown, choose a session and hit 'Start Monitoring' and voila! You can pause recording and also save a session for later analysis. The charts are zoomable.
MONyog stores Real-Time data gathered in a session in SQLite. You can find them in the 'data' folders under 'realtimedata'.
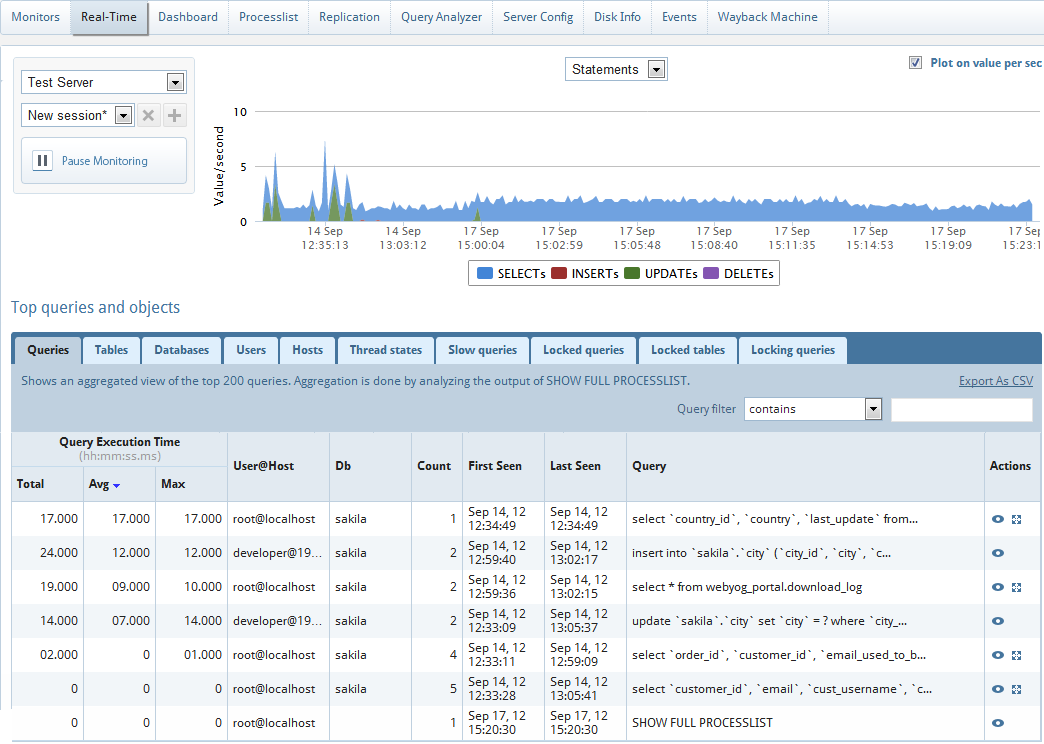
Real-Time gives you details of your server activity.
The 'Queries' tab gives you an aggregated view of the queries that are executed in a session. This information is obtained from the "SHOW FULL PROCESSLIST". You will get additional information like execution time, user/host information, the total count for each query. You do not have to enable general log to retrieve his information.
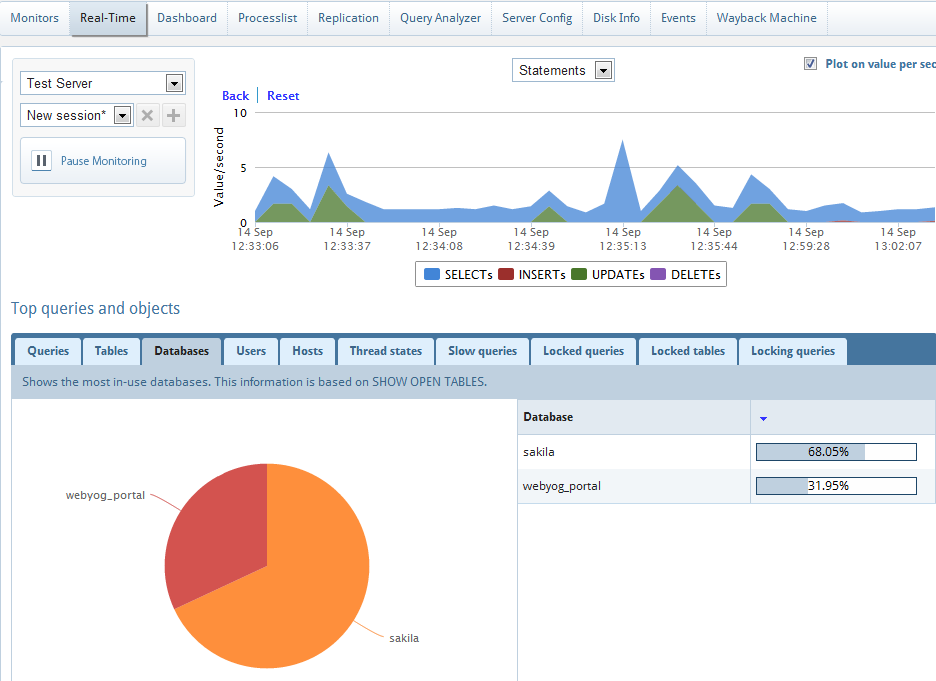
The 'Tables' and 'Databases' tabs detail information retrieved using SHOW OPEN TABLES;
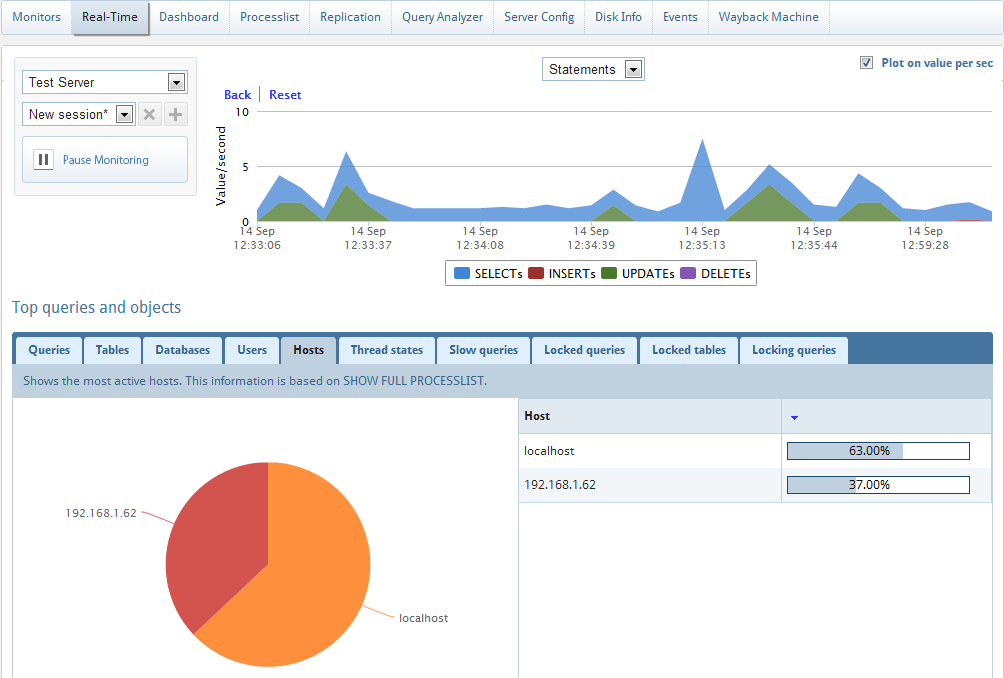
The 'Hosts', 'Users' and 'Slow queries' are again fetched from the SHOW FULL PROCESSLIST; and aggregated information is displayed.
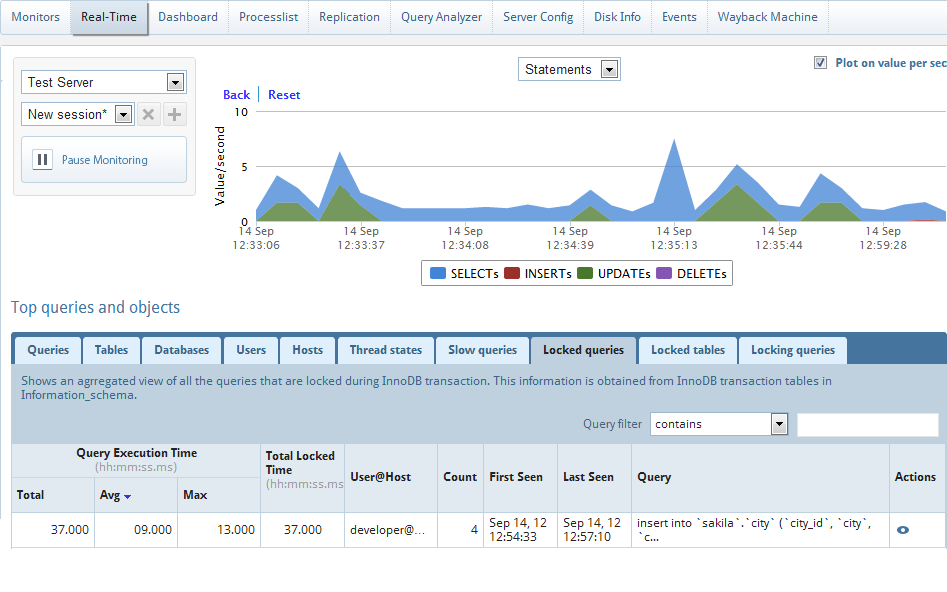
The 'Locked queries', 'locking queries' and 'locked tables' tabs are fetched from InnoDB transaction tables.
NOTE: For MySQL versions above 5.1, InnoDB plugin has to installed to retrieve locked and locking query information. But for 5.5 onwards MySQL comes with InnoDB storage engine. Refer documentation for more details.
NOTE: This feature is available in MONyog Enterprise and Ultimate.
|
|